Gross Domestic Product or GDP is the aggregate monetary value of final goods and services produced within the geographical boundary of a country within a specific time, normally a year.
Why is GDP the most widely used National Income Accounting?
GDP is the most commonly used concept or indicator of National Income Accounting due to the following reasons.
- GDP measures the domestic or internal capacity of the economy, and it is better to compare other indicators such as foreign trade, remittance, government expenditure, money supply, etc, in terms of GDP. It makes GDP more frequently used in practice.
- GDP is the fundamental concept of NIA, and the rest of the others are derived from GDP. It is better to use fundamental concepts than derived ones to avoid errors in derivations.
- GDP is said to be more reliable than other concepts of NIA because GDP uses the domestic information where the government authority has every access to information within the country, and it can be collected more reliably. However, for NGP and other indicators, we need information on the contribution of domestic factors, abroad, and the government should rely on the external data.
- GDP has been in practice for years to assess the performance of the economy, such as economic growth for years. So, as the continuity of convention, it is more in practice.
Methods of Measuring GDP
There are 3 approaches for measuring the GDP.
- Expenditure Method
- Consumption Expenditure (C)
- Investment (I)
- Government Expenditure (G)
- Net Export (X-M)
- Income Method
- Product Method
- Final Product Method
- Value Added Method
1) Expenditure Method of Measuring GDP
In the expenditure method of measuring GDP, we divide the whole economy into four different sectors, such as
- Household sector
- Business sector
- Government sector
- Foreign sector
Then, we estimate the total expenditure made by each of these sectors during the specific period and aggregate then to get the value of GDP at market price. The expenditure is estimated in terms of
1. Consumption expenditure (C)
It is the total expenditure made by the household sector during the given period. Such expenditure is estimated in terms of expenses on food. Non-food and services made by the household sector using appropriate data, such as the Living Standard Survey.
2. Investment (I)
It is the total expenditure made by the private sector during the given period. The expenditure is estimated in terms of the private sector expenses on machinery and equipment, buildings, both factors, and residential, and the inventory with the private sector.
3. Government expenditure (G)
It is the total expenditure made by all layers of government during the given period, and such expenditure is estimated in terms of government expenses on goods and services.
4. Net export (X-M)
It is the net expenditure made by the foreign sector on the domestic goods and services. It is estimated as the gap between the export and import of goods and services. Once we estimate all such expenditure, we aggregate them to get the value of GDP at the market price.
i.e. GDP at MP = C + I + G + (X -M)
Example – GDP by Expenditure Method
| S.N. | Heading | Rs. in billion | |
|---|---|---|---|
| 1 | Consumption (C) | 1000 | |
| Food | 200 | ||
| Non Food | 300 | ||
| Services | 500 | ||
| 2 | Investment (I) | 1100 | |
| Machinary & Equip. | 300 | ||
| Buildings | 600 | ||
| Inventory | 200 | ||
| 3 | Govt. Exp (G) | 600 | |
| Goods | 100 | ||
| Services | 500 | ||
| 4 | Net Export (X -M) | -200 | |
| Goods & Services Exp. | 500 | ||
| Goods & Services Imp. | 700 | ||
| GDP (in MP) | 2500 |
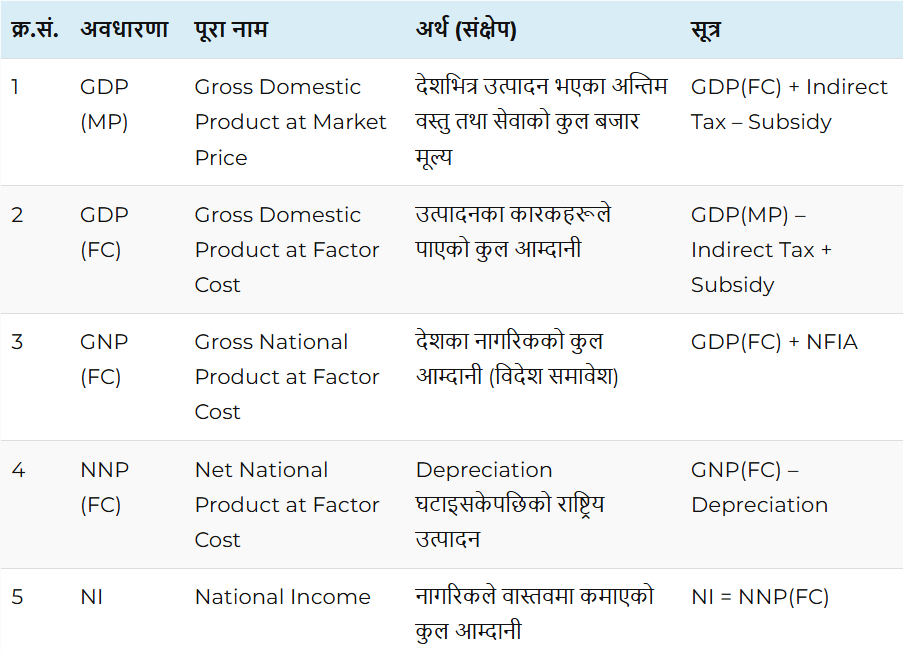
2) Income Method of Measuring GDP
In this method of measuring GDP, we classify the whole domestic factors into labor, land, capital, and organization. Then we estimate the total earnings of these factors using the given period and aggregate them, which gives (NI) or (NNP) at factor cost. Then we make some adjustments to the NI to get the GDP.
The income of these factors of production is estimated in terms of
- Wages, salaries, and any other compensation made to labor (W) – Labor income
- Rental income and royalties to the government for the use of natural resources or land (R) – Land income
- Interest income of capital (I) – Capital income
- Profit income of organization (P) – Organization income
Once we estimate the income of the factors using the reliable information, we aggregate them for NI or NNP at factor cost.
i.e. NI or NNP FC = W+R+I+P
Now, for computing GDP, we make a slide adjustment to NI or NNP FC as
NI or NNPFC + Depreciation = GNP FC
Again,
GNPFC – NFIA = GDPFC
Or, GDPMP = GDPFC + Indirect tax – subsidy
| S.N | Rs. in Billion | |
|---|---|---|
| 1. Wage | 500 | |
| 2. Investment | 400 | |
| 3. Rent | 400 | |
| 4.Profit | 700 | |
| NI or NNP (FC) | 2000 | |
| Add | + Depreciation | 500 |
| GNP (FC) | 2500 | |
| Subtract | - NFIC | 300 |
| GDP(FC) | 2200 | |
| Add | Net Indirect Tax | 300 |
| GDP (MP) | 2500 |
3)Product Method of Measuring GDP
i) Final Product Method
In this method, we have to identify the products produced only domestically and estimate the quantity ff each product produced and used as the final product during the given period. Then we collect the price information paid by the final consumer for each product. Finally, we aggregate the market value of all such final products to get the value of GDP and market price.
| Products | Qty of final consumption (Qi) | Price (Pi) | Market Value (Pi*Qi) |
|---|---|---|---|
| 1 | Q1 | P1 | P1Q2 |
| 2 | Q2 | P2 | P2Q2 |
| 3 | Q3 | P3 | P3Q3 |
| 4 | Q4 | P4 | P4Q4 |
| 5 | Q5 | P5 | P5Q5 |
| . | . | . | . |
| . | . | . | . |
| n | Qn | Pn | PnQn |
| GDP (MP) | 2500 |
This method is theoretically fine to measure GDP, but practically difficult to use due to some serious problems of double-counting.
ii) Value Added Method
Under this method, we classify the whole economic activities into different mutually exclusive sectors using a standard framework such as the system of national accounts. Then we estimate the value added by each of these sectors using the appropriate data, where value added is defined as the difference between the market value and the cost of production.
i.e., Value added – Market Value – cost of production
Once the value added by each of these sectors is estimated, we aggregate them to get the value of GDP at market price. Similarly, there is a practice of aggregating all the sectors into
- Primary sector
- Agriculture
- Fishing
- Forestry
- Mining and quarrying
- Secondary sector
- Manufacturing
- Consultation
- Electricity
- Drinking water and sanitation
- Tertiary sector
- BFIs
- Insurance
- Health and education
- Wholesale, retail, etc
Now, GDP MP = Value Added Primary + Value Added Secondary + …….. + Vn
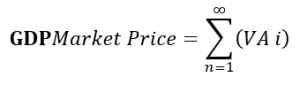
Where, VA = Value added by the ith sector
| S.N. | Sector | Value Added in Rs. Billion |
|---|---|---|
| 1 | Primary Sector | 700 |
| 2 | Secondary Sector | 500 |
| 3 | Tertiary Sector | 1300 |
| GDP (MP) | 2500 |
Therefore, GDP can be measured using expenditure income and product methods, where the value added method is used in practice under the product method. Whatever the method we use, we get the same value of GDP because we are measuring the economic activities of the same economy for the same period.
Which method of Measuring GDP is better and why?
→ All these three methods of measuring GDP have relative merits and demerits. So, we cannot immediately claim a method is better than another. It depends on the objective and availability of reliable data to determine the relative superiority of a method over others.
→ The expenditure method shows the expenditure dimension of the economy, such as consumption, investment, government expenditure, and net export. So, for the demand side analysis of the economy and demand management policy (FP & MP), the expenditure method is better.
→ Similarly, the income method shows the distribution of national income across the different factors of production. So, in order to study the distribution aspect of the economy and design appropriate distribution and redistribution policies, the income method is better.
→ In order to study the contribution of different sectors in the economy and to design appropriate macro and sectoral policies to promote the priority sector, value added method is used. It helps to know the sectoral shifts in the economy over the period.
→ Similarly, the availability and reliability of the data also determine the relative superiority of a method. For example, in developing countries like Nepal, the informal sector is dominant, and the sources of income are mostly informal, income-related data are less reliable. Income is under-reported and not easily noticeable. So, the income method may be less reliable due to a lack of adequate and reliable information. However, expenditure is more reliable than income. So, in comparison between the income and expenditure methods, the expenditure may be more reliable than the income.
→ In the same way, the expenditure method can also be underreported in the informal and underdeveloped economy, but it is easy to notice and value the product. So, value added method is better in the presence of an informal and underdeveloped economy where the income and consumption-related data are less reliable.
National Income Accounting in Nepal (NIA)
→ In Nepal, the National Statistics Office (NSO) is the central agency responsible for National Income Accounting. The NSO compiled and published national account statistics for more than 60 years. The process of preparing the national accounts began in 1961/62 AD, and the regular publication started from 1964/65.
→ Over the years. The National Statistics Office, earlier known as CBS (Central Bureau of Statistics), has revised the base year of the national accounts 5 times. The first change updated the base year from 1964/65 to 1974/75, followed by revisions to 1984/85, 1994/9,5 and 2000/01. The latest update of the base year is 2010/11, which is the current base year for National Income Accounting.
→ In order to maintain NIA, Nepal follows the system of national accounts 200,8, which is an internationally valid framework prescribed by the UNO. Following this standard framework, NSO uses the value-added method as the primary method and the expenditure method to validate and complement the gross value-added method.
→ NSO estimates GDP at both current and constant prices, where the constant price is from the base year 2010/11. The GDP is estimated for both the national and provincial levels. Similarly, NSO estimates the GDP annually and quarterly.
→ Under the value added method, the whole domestic economic activities are classified into 18 different mutually exclusive sectors following the Nepal standard industrial classification. This is compatible with the International Standard Industrial Classification of SNA 2008. Then the gross value added is computed as
GVA = Value of output – Value of intermediate consumption
→ The value added by each of the 18 sectors is estimated using the appropriate and authentic data source. For example, to estimate the value added by the agriculture, forestry, and fishing sector, NSO uses the data from the Ministry of Agriculture, Livestock Development, and the Department of Forest.
→ Once the value added by all of the 18 sectors is estimated, we aggregate them, which gives the value of GDP at market price. The expenditure method is also used by NSO as a complement and justification to the value-added method. Under this approach, GDP is calculated by adding various spending components such as household consumption, government consumption, investment, change in inventory, and net exports. Under the final consumption expenditure, the expenditure is classified into private final consumption, final consumption of general government, and consumption expenditure of nonprofit institutions serving households.
→ Similarly, the investment is estimated as gross capital formation, where the fixed capital formation by the private sector, government, and public enterprises is separately estimated. And the inventory changes are also included in gross fixed capital formation.
→ Finally, NSO estimates the exports/imports of goods and services, and finally, the difference between the exports and imports as the net export. Then NSO aggregates final consumption expenditure, gross fixed capital formation, and net exports, which gives the value of GDP at market price.
Limitations/Problems of GDP/NIA measurement in Nepal
- Large shadow economy – Informal economy/gray and illegal/black economy
- Existence of a large non-monetized sector (household)
- Lack of timely and regular surveys for data collection
- Poor institutional memory and data management system
- Lack of effective coordination and interaction among the institutions related to data
- Lack of skilled and efficient human resources for data collection, compilation, estimation, and interpretation.
- Poor public awareness of the value of real data.
- Poor adoption of advanced technology in data collection and management.
- Less priority on the data, evidence, and research & development
- Unable to include the new and emerging sectors of the economy in time.
Why rebasing the GDP?
While measuring GDP, we change the base of GDP due to the following reasons.
- The structure of the economy is changing over the period of and so to incorporate such change, we change the base year of GDP because the old base year becomes unrealistic.
- The relative prices of the goods and services change unevenly over time, and so using old prices distorts the real GDP.
- Over the period, new data sources and better coverage of the sector or economy are available, which have to include the previously unmeasured economic activities.
- If we continue the same base year for a long period, there may be overestimation or underestimation of the GDP, as well as sectoral misallocation of their share. So, to avoid base year bias, we change the base year regularly.