Average Cost Curve: Short-run and long-run average cost curve
Short-run Average Cost Curve
i) Average Fixed Cost (AFC) Curve: AFC is the per-unit fixed cost, and AFC continuously declines as the level of output increases. i.e., AFC = TFC/Q, then if Q↑, AFC↓

As the level of output increases, AFC is declining but cannot be zero, and it has the share of a rectangular hyperbola.
| TFC | Q | AFC = TFC/Q |
| 100 | 1 | 100 ↓ |
| 100 | 2 | 50 ↓ |
| 100 | 3 | 33.33 ↓ |
| 1000 | 4 | 25 ↓ |
Short-run Average Variable Cost (SAVC)
SAVC is the per-unit variable cost in the short run. Which initially declines, reaches a minimum, and then increases. So, the SAVC curve is U-shaped.

SAVC falls continuously up to the Q* level of output, where it is minimum, and then increases.
This U-shaped SAVC curve is due to the law of variable proportion in the short run.
Short-run Average Total Cost (SATC)
SATC is the total per unit cost in the short run, which initially declines, reaches a minimum, and then increases. So, the SATC curve is also U-Shaped.
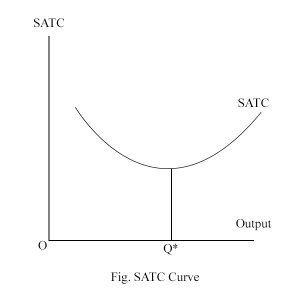
Here, SATC is declining continuously up to the Q* level of output at which SATC is minimum, and then increases. This U-shaped SATC curve is due to the law of variable proportion operating in short-run production.
SATC = P = AR = Break Even
SATC min = P = Shut Down Point
Long-run Average Cost Curve (LAC)
LAC is the per-unit cost in the long run, which initially declines, reaches a minimum, and then increases. So, the LAC curve is U-shaped, which shows the minimum possible per unit cost for the corresponding level of output when the firm expands in the long run.
So, the LAC curve is also called the planning curve. This guides the firm to expand in the long run.
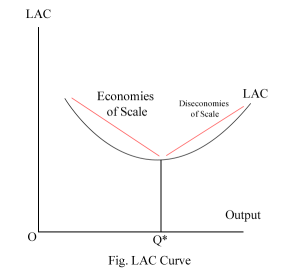
This LAC curve initially declines up to the Q* level of output and then increases. This U-shaped part of the LAC curve is a locus of returns to scale in the long-run production.
Other posts