The Phillips curve is an economic concept developed by A.W. Phillips in 1958, which shows the relationship between inflation and unemployment. Phillips studied the relationship between the changes in wage rate and unemployment rate of the British economy in 1958.
In his study, he found that there is an inverse and non-linear relationship between changes in wage rate and unemployment, which is known as the original version of the Phillips Curve.
- Inverse ⇒भन्नाले एउटा variable बढ्दा अर्को घट्ने सम्बन्धलाई जनाउँछ।
- Non-linear relationship ⇒ Change समान दरमा हुँदैन।

This shows that at a lower unemployment rate, the wage rate is increasing at a higher rate, and at a higher unemployment rate, the wage rate is growing at a slower rate.
Phillips did not provide the theoretical explanation for the existence of such an inverse and non-linear relationship, but later in the 1960s, Lipsey provided the theoretical foundation to this original version of the Phillips curve by integrating the labor market situation and the behavior of trade unions.
According to Lipesy, if the labor market is tight or has low unemployment, then trade unions are stronger in bargaining for a higher wage rate, and so the wage rate increases at a higher rate.
But if the labor market is loose or there is higher unemployment in the market, then trade unions are weaker in bargaining for a higher wage rate, and so the wage rate either does not increase or increases in slow pace.
This makes an inverse and non-linear relationship between the changes in wage rate and unemployment rate.
In the 1960s, Solow and Samuelson published a paper showing that when the wage rate increases continuously, it increases the price level, creating inflation. So, the ultimate trade off is with inflation and unemployement which is known as the Solow Samuelson modified version of the Phillips Curve and commonly known as the Phillips Curve in recent years.
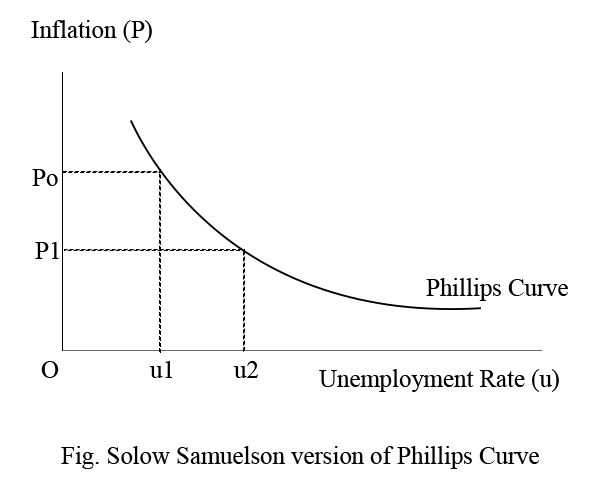
This shows that at higher inflation, the unemployment rate is lower, and at higher unemployment, inflation is lower. It means there is trade off between inflation and unemployment, which means inflation and unemployment both of them are both macro-problems, and cannot be minimized simultaneously.
If we try to reduce inflation, unemployment increases, and vice versa.
For example, if inflation is more serious, then we use the contractionary policies which reduce the aggregate demand and inflation, but on the other hand, unemployment increases due to a fall in aggregate demand and investment.
Similarly, if we use the expansionary policies, it increases AD, investment, and reduces unemployment, but inflation increases due to an increase in AD.
So, the Phillips curve suggests that policy prioritization, where if inflation is more serious than unemployment, then use contractionary policies to control inflation and let the unemployment increase, then unemployment becomes more serious, and so use the expansionary policies to reduce unemployment and let inflation increase. This makes inflation and unemployment cyclical.

Similarly, the Phillips curve also helps to have effective coordination between fiscal and monetary policy to achieve the targeted goals and inflation.
It means fiscal policy should be more growth-oriented to reduce unemployment, and the monetary policy should be focused on maintaining price stability or inflation control.
For this, inflation and growth can be pre-determined, and both policies should be accommodative to each other to attain the growth target and keep the inflation within the limit.
There are policy debates after Solow-Samuelson modified the Phillips Curve.
Friedman’s/Neo-Fisherian’s/Monetarist Version of the Phillips Curve
According to Friedman, the trade-off between inflation and unemployment is valid only in the short run, but in the long run, the economy is always at the natural rate of unemployment, which is constant. It means there is no trade-off between inflation and unemployment in the long run. So, the Phillips curve is said to be active only in the short run, and it is dead in the long run.
Friedman’s View on Phillips Curve:
According to Friedman, the behavior of labor is based on adaptive expectation, and so they expect the same inflation of the present to continue in the future.
So, when the central bank uses expansionary monetary policy, it reduces the interest rate, increases investment demand, which increases the labor demand, which increases the nominal wage rate.
When such wage rate increases, laborers are excited to supply more labor for work with the expectation that the existing inflation will continue in the future, and they can generate more real savings by working more hours.
This increases employment or reduces the unemployment rate of the economy. On the other hand, the actual inflation is also increasing due to expansionary monetary policy. However, labor does not know the increasing actual inflation immediately, which helps to reduce unemployment at the cost of inflation, but sooner or later, they realize that the market has fooled them, and they are discouraged from supplying more labor.
Similarly, the cost of living has increased, and the new labor force is not interested in supplying their labor at the existing wage rate due to the higher cost of living.
This gradually increases unemployment and ultimately reaches the natural rate in the long run.
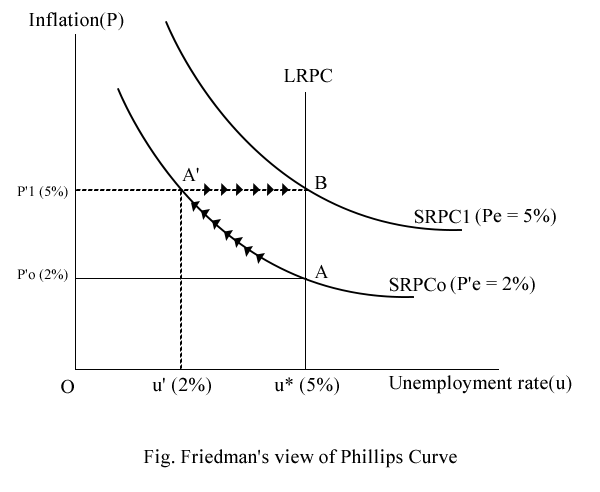
Here, the economy is initially at a point A with a natural rate of inflation P’o = 2%. So, the expected inflation by labor is 2%. Assume that the central bank increases the money supply in order to reduce unemployment. Such an increase in money supply increases labor demand through increased investment. Under the given labor supply, nominal wage rate increases, and under the expected inflation of 2% labor are encouraged to work more in order to generate more real savings. This reduces unemployment as well as increases inflation, but laborers are unaware of the increased inflation immediately. Once the economy reaches A’ with u’ unemployment and P’1 = 5%, then labor realizes that the actual inflation is more than their expectation. This discourages them from supplying more labor.
Similarly, the new labor force is not interested in working at the existing wage due to the higher cost of living. Then the unemployment rate gradually increases, and the economy ultimately reaches point B with the natural rate of unemployment u*.
If we join these two long-run points A and B, we get a perfectly vertical curve known as long run Phillips Curve. This shows that in the long run, the economy is at a constant unemployment rate, and so there is no trade-off between inflation and unemployment.
Uses/Importance of Phillips Curve
- The Phillips curve is a theoretical tool to explain the relationship between the fundamental macro issues, inflation, and unemployment, which helps the policymaker understand these issues.
- It helps to set the policy prioritization for inflation and unemployment. It recommends expansionary policy for reducing unemployment at the cost of inflation and contractionary policy to control the inflation at the cost of employment and growth.
- It helps to explain the cyclical nature of inflation and unemployment, which occurs in reality. This is due to the policy prioritization made by the government.
- It helps to guide the monetary policy based on the expected inflation, where most of the central banks in recent years make expected inflation survey and designed the policy accordingly to maintain stability and growth.
- The Phillips curve provides a basic framework for maintaining fiscal-monetary coordination in order to achieve growth and stability, with fiscal policy focused on growth, and monetary policy is accommodating to it by managing adequate liquidity for growth and controlling inflation within a limit.
Weaknesses/Limitations of Phillips Curve
- Unable to explain the problem of stagflation, where unemployment and inflation are simultaneously increasing.
- Better explain the demand side inflation, but not the supply side and structural inflation.
- Not able to explain if the markets are imperfect, and there is a lag in policy effectiveness.
- It does not work or is not able to explain the inflation and unemployment trade-off in the long run if the expectations are adaptive.
- Under rational expectations, there is no trade-off or Phillips relationship even in the short run.
Q. Globally and in Nepal, both inflation and unemployment are increasing simultaneously. Does it mean that the Phillips curve is completely irrelevant or useless?
Ans – The simultaneous increase in inflation and unemployment, often called stagflation, certainly makes the original 1958 Phillips curve seem irrelevant or broken. However, it does not mean the Phillips curve concept is completely useless. Rather, the concept has evolved into an expectations-augmented Phillips curve, which is still used by economists to understand complex, modern economic crises.
The original Phillips curve suggests that when unemployment is low, wages rise, and inflation increases. Conversely, high unemployment should lead to lower inflation.
- Global Context (Stagflation): When energy prices rise (supply shock), or when people expect high future inflation (anchored expectations), firms face higher costs and reduce production, causing both unemployment and prices to rise together.
- Nepal Context: Nepal often experiences “cost-push inflation,” where rising fuel prices in India (due to the currency peg), increased imports, or supply chain bottlenecks create inflation. At the same time, structural factors—lack of domestic industry, low investment, and a reliance on remittances keep unemployment high. This creates a stagflationary environment that the old curve cannot explain.
Is it Useless? No. It’s Just Evolved.
Economists have updated the Phillips Curve. The “New Keynesian” Phillips curve suggests that inflation depends on:
- Slack in the economy (unemployment),
- Expected future inflation.
If people expect inflation to stay high, prices will rise even if unemployment increases. Therefore, the curve hasn’t disappeared; it has shifted outward.
Why the Phillips Curve Fails to Explain Nepal Specifically
- Structural Unemployment: Unemployment in Nepal is largely structural (skill gaps, lack of industrialization, reliance on foreign employment) rather than cyclical. It doesn’t move just because inflation does.
- External Factors: Nepal’s inflation is mostly imported from India. If India has high inflation, Nepal does too, regardless of whether Nepali workers are employed or not.
- Dominance of Remittances: Remittances keep consumption high even when unemployment is high. High demand coupled with limited domestic supply = inflation, even with high unemployment.
What is the Modern Value of the Phillips Curve?
Even with stagflation, the Phillips curve is still used for:
- Understanding Inflation Drivers: It helps policymakers differentiate between demand-pull inflation (booming economy) and cost-push inflation (supply shocks).
- Modeling Expectations: It shows how important it is for central banks (like Nepal Rastra Bank) to maintain credible, low-inflation targets to manage public expectations.
- The Long-Run Perspective: Modern theory suggests that in the long run, the Phillips curve is vertical. You cannot reduce unemployment permanently by simply accepting high inflation.
In conclusion, the Phillips curve is not useless, but it is not a “plug-and-play” tool anymore. In a modern, globalized, and supply-shock-prone economy, a rising unemployment rate does not guarantee that inflation will fall.