Inequality is the uneven or unequal distribution of income, opportunities, access, resources, etc. It means the different individuals or households or the community have unequal distribution or shares in the variable under consideration is known as inequality. There are different dimensions or forms of inequality, such as:
- Economic inequality: Inequality in income, assets, and consumption.
- Political inequality: No political opportunity, access, or decision-making power.
- Cast/ethnicity-based inequality: Deprivation due to cast, ethnicity
- Gender based inequality: No equal opportunities, access to assets, wages, rights
- Geographical inequality: No equal opportunities for access or service, opportunity due to location
Measurement of inequality
1) Lorenz Curve
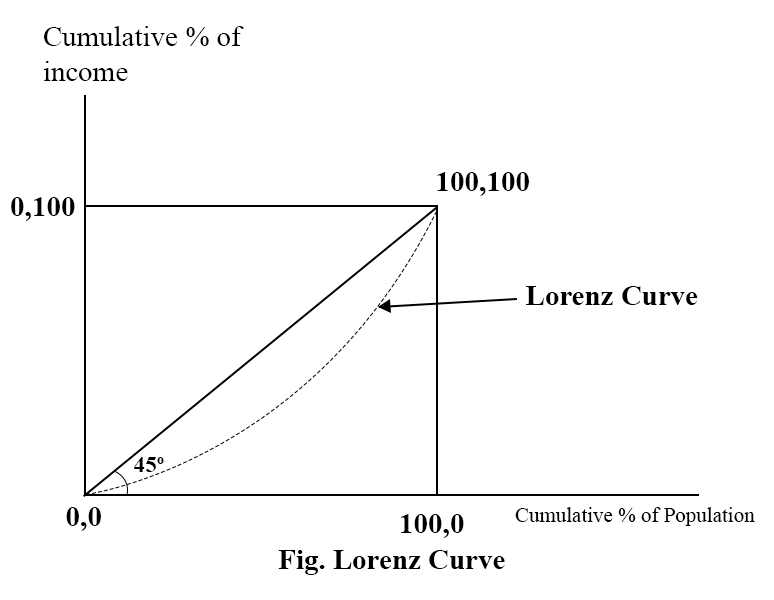
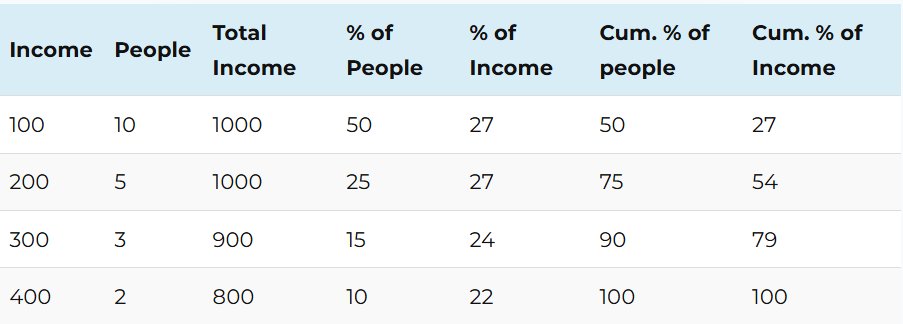
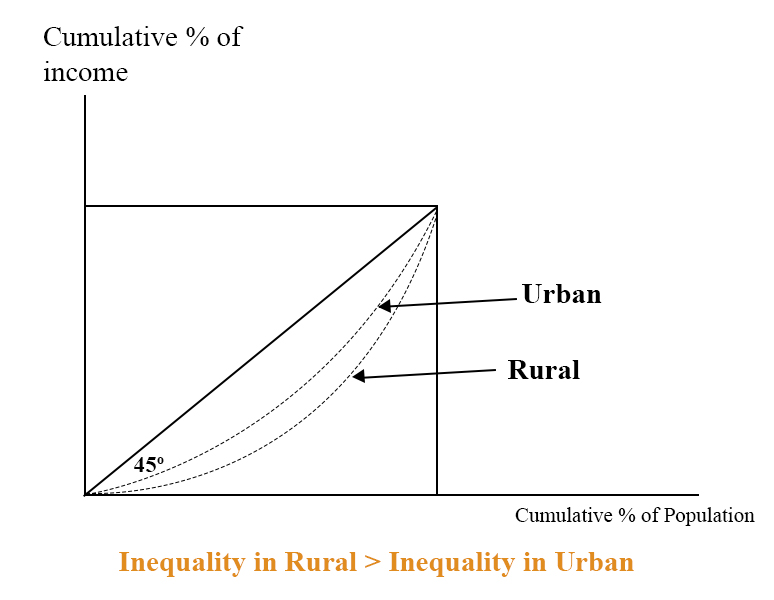
It is a graphical measurement of inequality where we derive the Lorenz Curve by plotting the cumulative percentage of the population along the horizontal axis and cumulative % of the variable, such as income/wealth, etc, on the vertical axis. The 45° line, which connects the cumulative % (0,0) and (100,100), is called the line of perfect equality, and the gap between the Lorenz Curve and the 45° line represents the inequality. The larger this gap, the higher the inequality is.
2) Gini Coefficient (GC):
It is the most commonly used measure of inequality. It is computed using the Lorenz Curve, where GC is calculated as the ratio of the area between the line of 45° and the Lorenz Curve, and the total area below the 45° line.
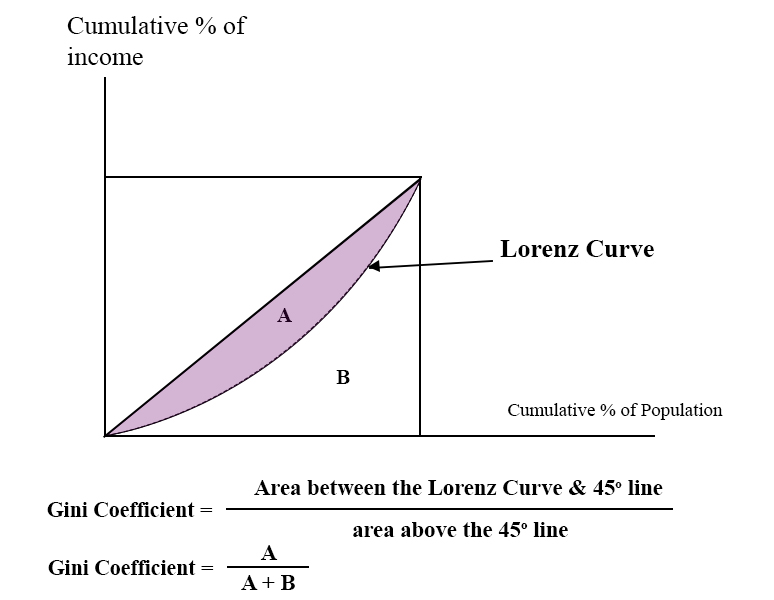
Gini Coefficient (GC) lies between 0 to 1, i.e., 0≤ GC ≤ 1
- If GC = 0, there is perfect equality
- If GC = 1, there is perfect inequality
- If GC is closer to 0, there is less inequality (more equality)
- If GC is closer to 1, there is less equality (more inequality)
3) Hover Index/Robin Hood Index:
This index measures the proportion of income to be taken from rich people and redistributed to the poor so that there is perfect equality in the distribution of income in the society. It means that to make the society perfectly equal in the distribution of income, we have to take some part of the income from rich people and distribute it to the poor. This index measures the proportion of income.
Graphically, the Hover Index is represented by the maximum gap between the Lorenz Curve and the 45° line.
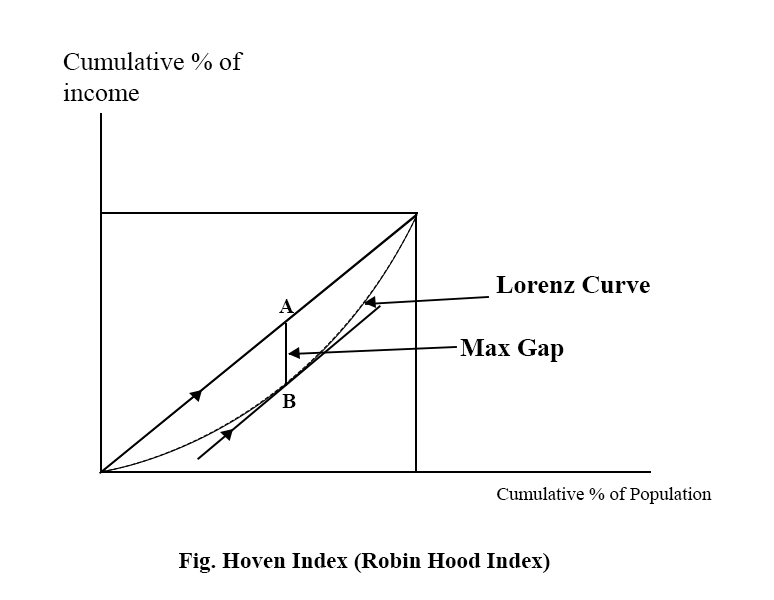
Here, AB represents the maximum gap, which represents the Hoven Index. This implies that the AB proportion of income required to redistribute to poor people is necessary to maintain perfect equality in the distribution of income.
4) Various Ratios & shares in distribution:
In this method, we divide the whole population into different groups under the ascending order of the income or assets, etc, and compare the lower and upper groups in the distribution. The most commonly used indicators are
- Percentile → In this method, the whole population is divided into 100 equal parts in terms of the ascending order of the income or assets, then we compare the top 1% and bottom 1% in terms of their shares to find the inequality. The larger the gap between them higher the inequality.
- Deciles – In this method, the whole population is divided into 10 equal parts in ascending order of income, and the share is calculated. Then we compare the share of the top 10% and the bottom 10%.
- Quartiles – In this method, the whole population is divided into 4 equal parts in ascending order of the income, and the share is calculated. Then we compare the share of the top 25% and the bottom 25%.
- 20-20 Ratio – Ratio of the share of the top 20% and bottom 20%. The higher the ratio, the higher the inequality.
- Palma ratio – Share of top 10% / share of bottom 40%
- Kuznets ratio – share of top 20% / share of bottom 40%
5) Statistical measures:
Range – Highest value – lowest value
Quartile deviation – Q3 -Q1/2
Coefficient of variation (Cv) – a valid statistical measure of income inequality, defined as the ratio of the standard deviation to the mean of the income distribution. It is a general measure of dispersion that can be applied to income data.
Why are poverty and inequality measured?
Both poverty and inequality are the basic issues of economic development, where the goal of development is to reduce both of them. So, poverty and inequality are measured for the following reasons.
- To know the status of poverty and inequality in society
- To identify the factors affecting them
- To design an appropriate policy for reducing poverty and inequality
- To examine the effectiveness of the poverty and inequality reduction policies, programs, and projects.
(In Nepal, the poverty index was first measured in 1995/96. There were around 42% of the total population was below the poverty line.
Poverty and inequality in Nepal
Nepal started to measure poverty formally from 1995/96 with the first round of Nepal Living Standard Survey (NLSS). Since then, Nepal has conducted 4 rounds of such surveys, which show that the rate of poverty has declined significantly. For example, in the first round of survey (NLSS 1995/96) there were around 42% (41.76) of the population was below the poverty lines, which declined to 20.27% in 2022/23. Though the poverty has declined overall, it has not declined homogeneously across the rural/urban, cast & ethnicity, ecological belt, and across provinces.
For example, the rural poverty (24.66%) is higher than urban (18.34%) as of NLSS 2022/23. Similarly, Sudurpaschim province has the highest poverty rate (34.16%) while Gandaki Province has a lower poverty rate (11.88%). This indicates the distribution of poverty is not uniform across the provinces. Kathmandu valley has the lowest poverty rate (7.38%), whereas Sudurpaschim rural area has the highest poverty rate (40.21%) as of the NLSS 2022/23.
Not only has the poverty rate declined, poverty gap index and square gap have also declined over the period. For example, the poverty gap index of Nepal was 11.75% in 1995/95, which declined to 4.52% in 2022/23. This shows that the depth of poverty is declining.
Similarly, the square poverty gap index was 4.67% in 1995/96, which declined to 1.48% in 2022/23. This shows that poverty has become less severe in recent years.
Though the poverty rate declined rapidly, the no. of poor people did not decline in such a number. For example, in 1995/96, around 86 lakhs people were below the poverty line, which is still more than 60 lakhs. It means during these two and half decades, Nepal could bring around 35 lakhs people out of poverty line. This Gini Coefficient has also declined in the NLSS 2022/23. Gini Coefficient was 0.322 (32.24%) in NLSS 1995/9,6 which increased to 0.414 (41.4%) in 2003/4 and declined to 0.30 (30%) in 2022/23.
Factors causing poverty reduction in Nepal
Nepal has made significant progress in poverty reduction despite slow and volatile economic growth, showing a puzzle in the growth-theory relationship. The rate of poverty was around 42% in 1995/95, which declined to around 20% in 2022/23. Whereas the average growth rate during this period is below 5%. So, the various studies have justified this paradox due to the following reasons.
- Foreign migration from employment and remittance income.
- Diversification of domestic economic activities and opportunities.
- Increased farm income, as well as an increase in income from other economic activities.
- Increase investment in human capital by both households and the government.
- The government’s priority is on poverty reduction, and the programs of poverty reduction are accordingly.
- Increase access to infrastructure, market, health, and education.
- Increase in financial access and financial literacy.
- Increase access to ICT, and increase public awareness and technology transfer.
- Development of rural infrastructure and increased mobility.
- Expansion of non-farm employment and urbanization.
- Expansion of the private sector due to liberal government policy and increased economic opportunities.
- Support for poverty reduction by the development programs such as USAID, JICA, DFID, and many other NGOs and INGs.
Initiatives for poverty reduction in Nepal
Poverty reduction has always been the priority of Nepal since the implementation of the first periodic plan, but it was only the 6th plan that clearly stated the objective of poverty reduction for the first time. The 7th periodic plan prioritized poverty reduction through fulfillment of basic needs. The 8th periodic plan initiated a comprehensive market-oriented reform by realizing that the market or private sector can create more economic opportunities and support for poverty reduction. Ince then, the market of the private sector is also considered a main vehicle for poverty reduction. The 9th periodic plan started the long-term perspective on poverty reduction, whereas the 10th periodic plan, also known as the poverty reduction strategy paper (PRSP), has a single objective of poverty reduction. Then, the 11th or interim plan took the inclusive approach of poverty reduction through some positive discrimination in order to reduce poverty. Similarly, the periodic plan after the 11th plan has considered the market and government-based poverty reduction approach initiated by the 8th periodic plan, the long-term strategies of poverty reduction as of the 9th plan, targeted program, governance, and infrastructure development for poverty reduction as by the 10th plan, and the inclusive approach to poverty reduction by the 11th plan. So, the current 16th plan has considered poverty reduction based on these broad aspects.
Nepal’s overall poverty reduction initiatives are multidimensional, combining growth, social protection, human development, and inclusion. The poverty reduction initiatives are related to the adoption of poverty reduction as a central goal of the periodic plan, commitment to fulfil the SDG goal no.1 (no poverty by 2030), shift from only growth to the inclusive pro-poor growth, and federal restructuring to enable local government for poor identification and targeting.
Based on these national initiatives, there are no of poverty reduction policies, strategies, and programs. The main policies related to poverty reduction are the periodic plan, sectoral policies such as agriculture development strategies, industrial policy, commercial policy, education policy, etc, and the macroeconomic policies such as the annual budget of federal, provincial and local government and monetary policy to support financial inclusion and poverty reduction.
Similarly, the poverty reduction strategies practiced in Nepal are mainly
- Pro-poor and inclusive economic growth, such as a priority on agriculture. SMEs, rural infrastructure, etc.
- Employment-centred strategy, such as the Prime Minister’s Employment Program, skill development and vocational training, facilitation to foreign employment, and priority to domestic employment creation.
- Human development strategies such as free basic education, free basic health, nutrition support program, etc.
- Social protection strategies such as social security allowances, health insurance, agriculture insurance etc.
- Targeted programs such as the border area development program, backward region development program, and targeted program for marginalized communities.
- Based on these broader policies and strategies, there are a number of programs and activities carried out for poverty reduction. The majority of them are:
- Youth and self-employment programs which provide skills-based training, startup support, concessional financing, incentives and subsidies, etc.
- Social security allowances such as allowances for the senior citizen, differently abled, single women and endangered ethnic groups.
- Agriculture and rural development programs, such as subsidies for fertilizer & seeds, crops and livestock insurance support, support for immigration, rural infrastructure development, etc.
- Financial inclusion programs such as micro credit, cooperatives, concessional loans to small entrepreneurs, etc.
- Education and health-related programs such as free basic education, scholarships for poor and marginalized communities, national health insurance programs, free basic health services, etc.
- Targeted programs such as the remote area development program, development programs for Karnali and the Far Western region, etc.
Major Issues and Challenges of Poverty Reduction in Nepal
- Problems in identifying and targeting the real poor.
- Overlapping programs and projects of poverty reduction.
- Donor-driven and supply-side programs and projects of poverty reduction.
- High vulnerability in poverty reduction or poor sustainability.
- Poor coordination among the policies, programs, and projects of poverty reduction.
- Issue of corruption and leakages of the poverty reduction budget.
- Ambitious target of poverty reduction.
- Poor monitoring and evaluation of the programs and projects.
- Less focus on capacity building of the poor and priority on direct transfer of cash.
- Poor community ownership of poverty reduction programs and projects due to a lack of their effective participation.
- Ill interest of a certain group for the continuity of poverty.