Previously, we discussed the Inter-temporal Choice in Consumption. The next theory is N-M utility theory. Neumann Morgenstern Utility theory is one of the theories to explain consumption under risk and uncertainty in economics.
- It is also called the NM Utility index
- It was developed by Von Neumann and Oscar Morgenstern in 1947
This is the first theory to integrate risk and uncertainty in decision-making, which uses both utility and probability to explain the behavior of the individual and society during risk and uncertainty. According to this theory, the rational individual tries to maximize expected utility in the situation of risk and uncertainty.
So, we can construct a utility index for the rational individual and can explain how the individual reacts in the situation of risk and uncertainty.
Constructing the utility index is a systematic process that normally follows the following steps
STEP 1: Identify the possible outcomes of the event associated with risk and uncertainty.
Let there be a lottery ticket with prize money of Rs. 100000. The prize for the winner is Rs. 100000, and 0 for the loser.
Winner (W) = 100000/-
Loser (W`) = 0/-
STEP 2: Assign probability for each possible outcome using some theories, literature, experts, own experience, or pilot test.
Assume that the probability of winning the lottery is 0.6 and the probability of not winning is 0.4.
i.e. Probability of winning P(W) = 0.6
Probability of not winning P(W`) = 0.4
STEP 3: Assign the utility for the outcomes arbitrarily.
Assume that the utility from winning the lottery is 100 units and the utility from not winning is 0.
i.e. Utility from winning U(W) = 100 utils
Utility from not winning U(W`) = 0 utils
STEP 4: Calculate the expected utility of the event.
The expected utility of the lottery is
Expected utility E(U) = P(W).U(W) + P(W`).U(W`)
Or, E(U) = 0.6 x 100 + 0.4 x 0
Or, E(U) = 60 utils
STEP 5: Find the certainty equivalent of the event
It is a certain/sure sum of money that the individual is ready to pay for the lottery ticket with the given probability and the winning amount. In order to find such a certainty equivalent, we have to visit the individual and ask them how much money they are ready to pay for this lottery with the given prize and probability.
Assure that the individual says he or she is ready to Rs. 100000 /- for the lottery, then this is the certainty equivalent. It is assumed that this Rs. 100000 has the equal value or utility as the expected utility of the lottery.
That means:
- U (Rs. 100000) = E (U)
- U (Rs. 100000) = 60 utils
If we repeat the same question to the same individual under different probabilities of winning the lottery, we get different certainty equivalents and corresponding utilities. Such a complete list of the income and utility is known as the N-M Utility index.
| Income | Utility |
|---|---|
| Rs. 0 | O utils |
| Rs. 10000 | ..... |
| Rs. 50000 | 50 utils |
| Rs. 70000 | ..... |
| Rs. 100000 | 100 utils |
Once we have a complete N-M utility index, we can explain the behavior of the individual under the risk and uncertainty.
- If the index shows that the total utility is increasing at an increasing rate or the marginal utility of money income is increasing, the individual is a risk-taker or risk lover.
- If the index shows that total utility is increasing at a decreasing rate or the marginal utility of money is diminishing, then the individual is a risk averter.
- If the total utility index is increasing at a constant rate or the marginal utility of money is constant, then the individual is risk neutral
| N-M utility index | Marginal Utility | Behavior |
|---|---|---|
| Increasing at an increasing rate | marginal utility of money income is increasing | risk lover |
| increasing at a decreasing rate | marginal utility of money income is diminishing | risk averter |
| increasing at a constant rate | marginal utility of money income is constant | risk-neutral |
Tabular representation of N-M Utility Theory
| Money Income | TUa | TUb | TUc |
|---|---|---|---|
| 0 | 0 | 0 | 0 |
| 100 | 10 | 10 | 10 |
| 200 | 25 | 19 | 20 |
| 300 | 45 | 27 | 30 |
| 400. | 70 | 34 | 40 |
| Risk Lover | Risk Avoider | Risk Neutral |
Where,
- TUa = total utility of A
- TUb = total utility of B
- TUc = Total utility of C
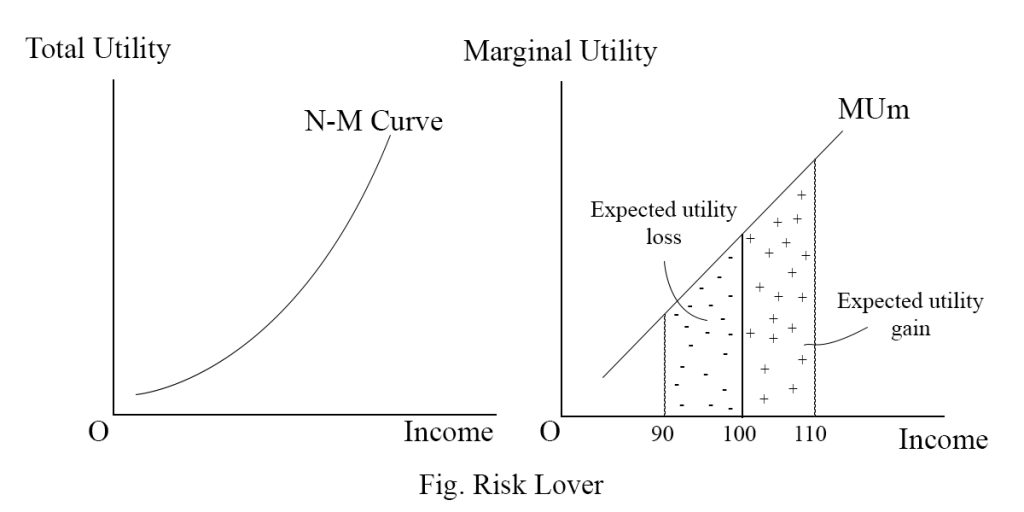
If the total utility from money income is increasing at an increasing rate or the marginal utility of money is increasing, then the expected gain in utility is more than the expected loss for the individual. This motivates the individual to take risks.
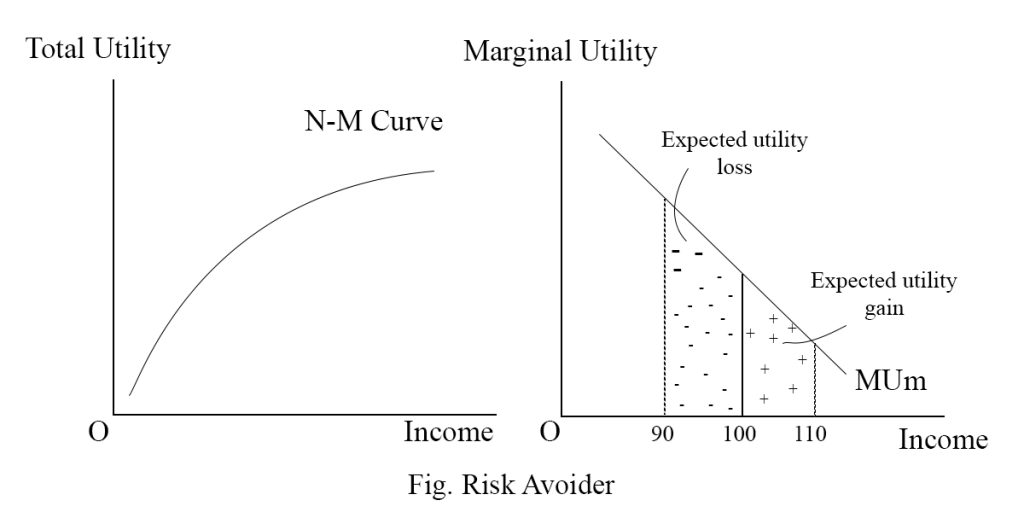
For the risk-averse individual, the total utility from marginal income is increasing at a decreasing rate, or the marginal utility of money is diminishing. In such a case, the expected gain is less than the anticipated loss of utility. This discourages the individual from taking risks and makes them a risk-avoider.
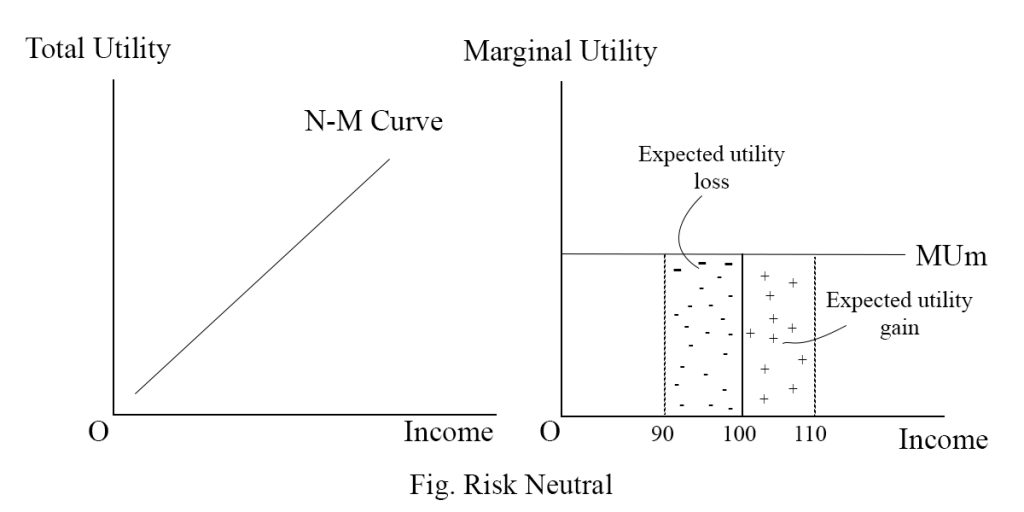
For the risk-neutral, individual marginal utility of money is constant, or total utility is increasing at a constant rate. In such a case, the expected gain and loss in utility are equal. This makes the individual risk neutral.
Other posts:
- Inter-temporal Choice in Consumption (Derivation with Diagram)
- Solow – Swan Growth Model (Derivation with Diagram)
- Endogenous Growth Theory (Derivation with Diagram)